TIMEFRAME ALIGNMENT TRADING
A Simple Guide to Smart Money Concepts
WHAT IS TIMEFRAME ALIGNMENT?
Timeframe alignment is a trading strategy where you look at multiple chart timeframes at the
same time. Instead of just checking one chart (like the 15-minute chart), you check three
different timeframes to get a complete picture of what the market is doing.
Think of it like this: looking at one timeframe is like looking through a keyhole. You can see
something, but not the whole picture. Looking at multiple timeframes is like opening the door –
you see everything clearly.
The main idea is simple: when all timeframes show the same direction, your trade has a much
better chance of success.
THE THREE TIMEFRAME SYSTEM
Most successful traders use three timeframes:
- HIGH TIMEFRAME (The Big Picture)
- Shows the overall trend
- Examples: Daily chart, 4-hour chart
- Purpose: Know which direction the market is going
- MIDDLE TIMEFRAME (The Setup)
- Shows where to look for trading opportunities
- Examples: 1-hour chart, 15-minute chart
- Purpose: Find specific trading setups3. LOW TIMEFRAME (The Entry)
- Shows exactly when to enter the trade
- Examples: 15-minute chart, 5-minute chart
- Purpose: Get the best entry price
The timeframes should be related by a factor of 4-6. For example, if you trade on 15-minute
charts, use 1-hour and 4-hour for higher timeframes.
WHAT ARE SMART MONEY CONCEPTS?
Smart money means the big traders – banks, hedge funds, and institutions. These traders
have enough money to move the market. Smart money concepts help you follow what they’re
doing instead of trading against them.
Key Smart Money Ideas
MARKET STRUCTURE: This is the pattern of highs and lows on your chart. Uptrend shows
higher highs and higher lows. Downtrend shows lower highs and lower lows. When this
pattern breaks, the trend might be changing.
ORDER BLOCKS:
These are areas where big traders placed large orders. The price often
bounces from these zones. They look like consolidation areas on your chart before big price
moves.
LIQUIDITY POOLS: These are areas where many traders put their stop losses, usually above
recent high points or below recent low points. Big traders target these areas to fill their orders
before the price moves the other way.
FAIR VALUE GAPS: These are empty spaces on the chart where price moved so fast it left a
gap. The market often comes back to fill these gaps later.
HOW TO USE TIMEFRAME ALIGNMENT
STEP 1: Check the High Timeframe
Open your highest timeframe chart (example: 4-hour or daily). Look for the overall trend
direction, major order blocks, fair value gaps, and liquidity pools. Write down whether this
market is bullish or bearish.
Rule: Only look for buy trades in bullish markets, sell trades in bearish markets.
STEP 2: Find Setups on Middle Timeframe
Open your middle timeframe chart (example: 1-hour). Make sure it agrees with the high
timeframe. If high timeframe is bullish, look for bullish setups here. Look for price coming back
to an order block, liquidity sweeps, fair value gaps being filled, and structure breaks in the
trend direction.
STEP 3: Time Your Entry on Low Timeframe
Open your lowest timeframe chart (example: 15-minute). Wait for confirmation that the setup is actually happening.
Look for price touching the order block or fair value gap, a change in direction,
and signs that momentum is shifting your way.
Enter the trade with a tight stop loss.
SIMPLE EXAMPLE
Let’s say you’re trading EUR/USD:
HIGH TIMEFRAME (4-hour chart):
The pair is making higher highs and higher lows = UPTREND. There’s an order block at
1.0850 where price bounced strongly before. Direction: BULLISH – only look for buy trades.
MIDDLE TIMEFRAME (1-hour chart):
Price has pulled back and is now near the 1.0850 order block.
(many stop losses there). Setup: Wait for price to interact with this zone.
LOW TIMEFRAME (15-minute chart):
Price drops to 1.0853, sweeps the liquidity below 1.0855. Then quickly reverses back above
1.0855. Starts making higher lows on 15-minute chart. Entry: BUY at 1.0860, stop loss at
1.0845.
All three timeframes agree: bullish trend, setup at key zone, entry signal confirmed.
COMMON MISTAKES TO AVOID
- Trading Against the High Timeframe: Never take a buy trade if the 4-hour chart shows a
downtrend, even if the 5-minute chart looks bullish. The high timeframe almost always wins. - Using Too Many Timeframes: Stick to three timeframes. Using 5 or 6 timeframes makes
everything confusing. Three is enough. - Forcing Trades: Sometimes the timeframes don’t align. When this happens, don’t trade.
Wait for clear alignment across all three timeframes. - Wrong Timeframe Ratios: Don’t use a 1-minute chart with a monthly chart. Keep your
timeframes related (4x to 6x difference between each). - Ignoring Risk Management: Even with perfect timeframe alignment, use stop losses. No
setup wins 100% of the time.
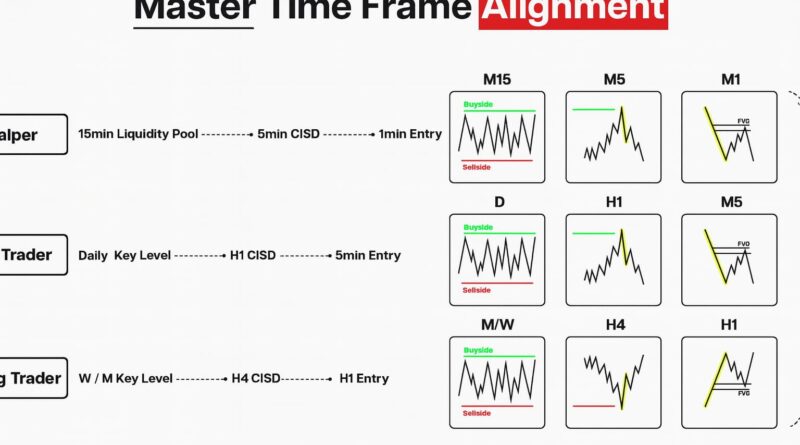
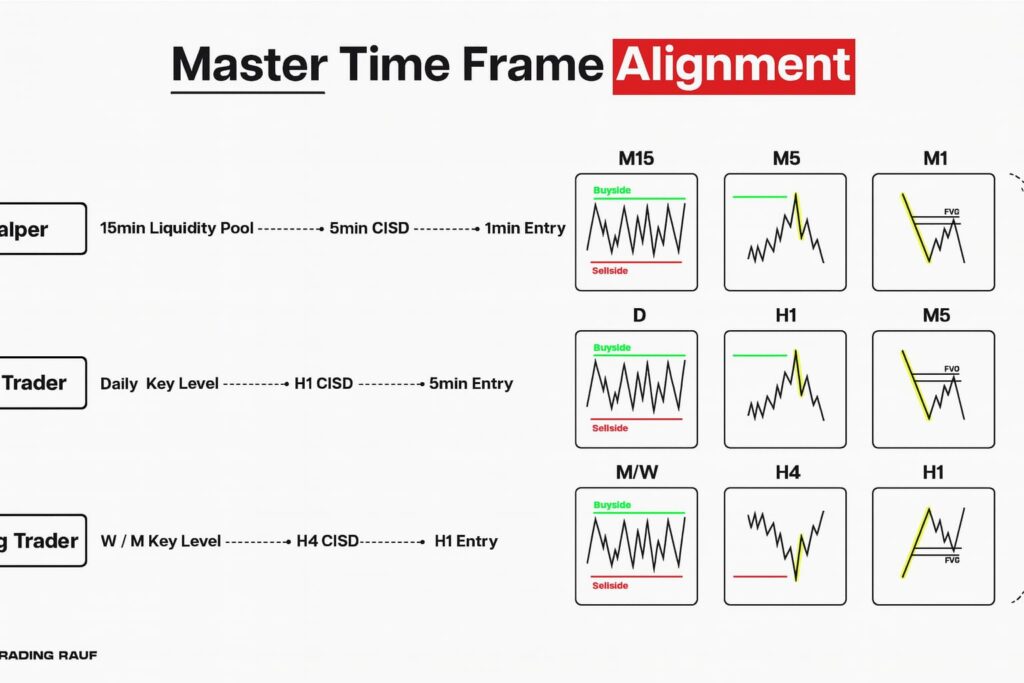
HOW TO PRACTICEChoose Your Timeframes: Pick three timeframes based on your trading style. Scalpers use
1-min, 5-min, 15-min. Day traders use 15-min, 1-hour, 4-hour. Swing traders use 4-hour, daily,
weekly.
Start With One Market: Focus on one currency pair or stock. Learn how it moves across
different timeframes. Don’t jump around to many different markets.
Backtest: Look at historical charts. Find examples where all three timeframes aligned
perfectly. Study what happened next.
Keep a Journal: Write down every trade with screenshots of all three timeframes, what smart
money signs you saw, why you took the trade, and what happened. Review your journal weekly.
Be Patient: Start by just observing. Don’t trade real money until you can consistently identify
good setups on past charts. - TIPS FOR SUCCES
Start Simple: Don’t try to use every smart money concept at once. Start with identifying the
trend on high timeframe, find one order block on middle timeframe, and get entry signal on
low timeframes.
Focus on Alignment: The most important thing is that all timeframes point the same
direction. If high timeframe is bullish, middle timeframe is bullish, and low timeframe gives a
bullish signal – that’s a good trade.
Wait for the Right Moment: Good setups don’t come every hour. Sometimes you might wait
all day for the right alignment. That’s normal. The best traders are patient.
Trade Small at First: When you start trading with real money, use very small position sizes.
Your goal is to prove you can apply the strategy correctly, not to make money immediately.
FINAL THOUGHTS
Timeframe alignment with smart money concepts gives you a clear framework for trading.
You’re not guessing – you’re following a process: Check high timeframe for trend direction,
find setups on middle timeframe, time entries on low timeframe, and only trade when all three agree.
- This approach helps you trade with the big players (smart money) instead of against them.
It takes practice to recognize the patterns, but once you do, your trading will improve significantly.
Remember: Not every market situation provides clear signals. When alignment is unclear, the best action is no action.
Protecting your capital by avoiding bad trades is just as important as
making good trades.- FINAL DISCLAIMER: Trading carries substantial risk.
- This educational content does not guarantee
profits. Every trader must develop their own strategy that fits their risk tolerance and experience level.
Never invest money you cannot afford to lose. All trading decisions are your responsibility.
The information in this article should not be considered professional financial advice. If you need financial
advice, consult a licensed financial advisor.